I recently participated in the Metaculus Q4 2024 Quarterly Cup which is a forecasting tournament hosted by the forecasting platform Metaculus. I ranked in the top 15 - out of 379 participants. This sadly means that I didn’t earn one of the prized branded hats, as that would require placing in the top 3…
But I’ve learned some things that should help me improve for the next quarter.
This post format was inspired by xkqr’s Q3 retrospective.
What even is Forecasting?
Forecasting itself should be a fairly obvious term, it’s predicting the probability of some event in the future: for example, the probability of Donald Trump winning the election. The platform Metaculus hosts tournaments grouping different questions together, one of which is the quarterly cup. It contains about 50 questions and runs for a period of 90 days.
Scoring a forecast is usually done using a logarithmic score, but the exact implementation varies. As outlined in Metaculus’s scoring FAQ, a baseline score is calculated first, which spans from -897 to +100 and is logarithmic. By definition, you get exactly 0 points if you predict a 50% chance on a binary question (or a uniform distribution on continuous questions). With a better forecast, your score increases.
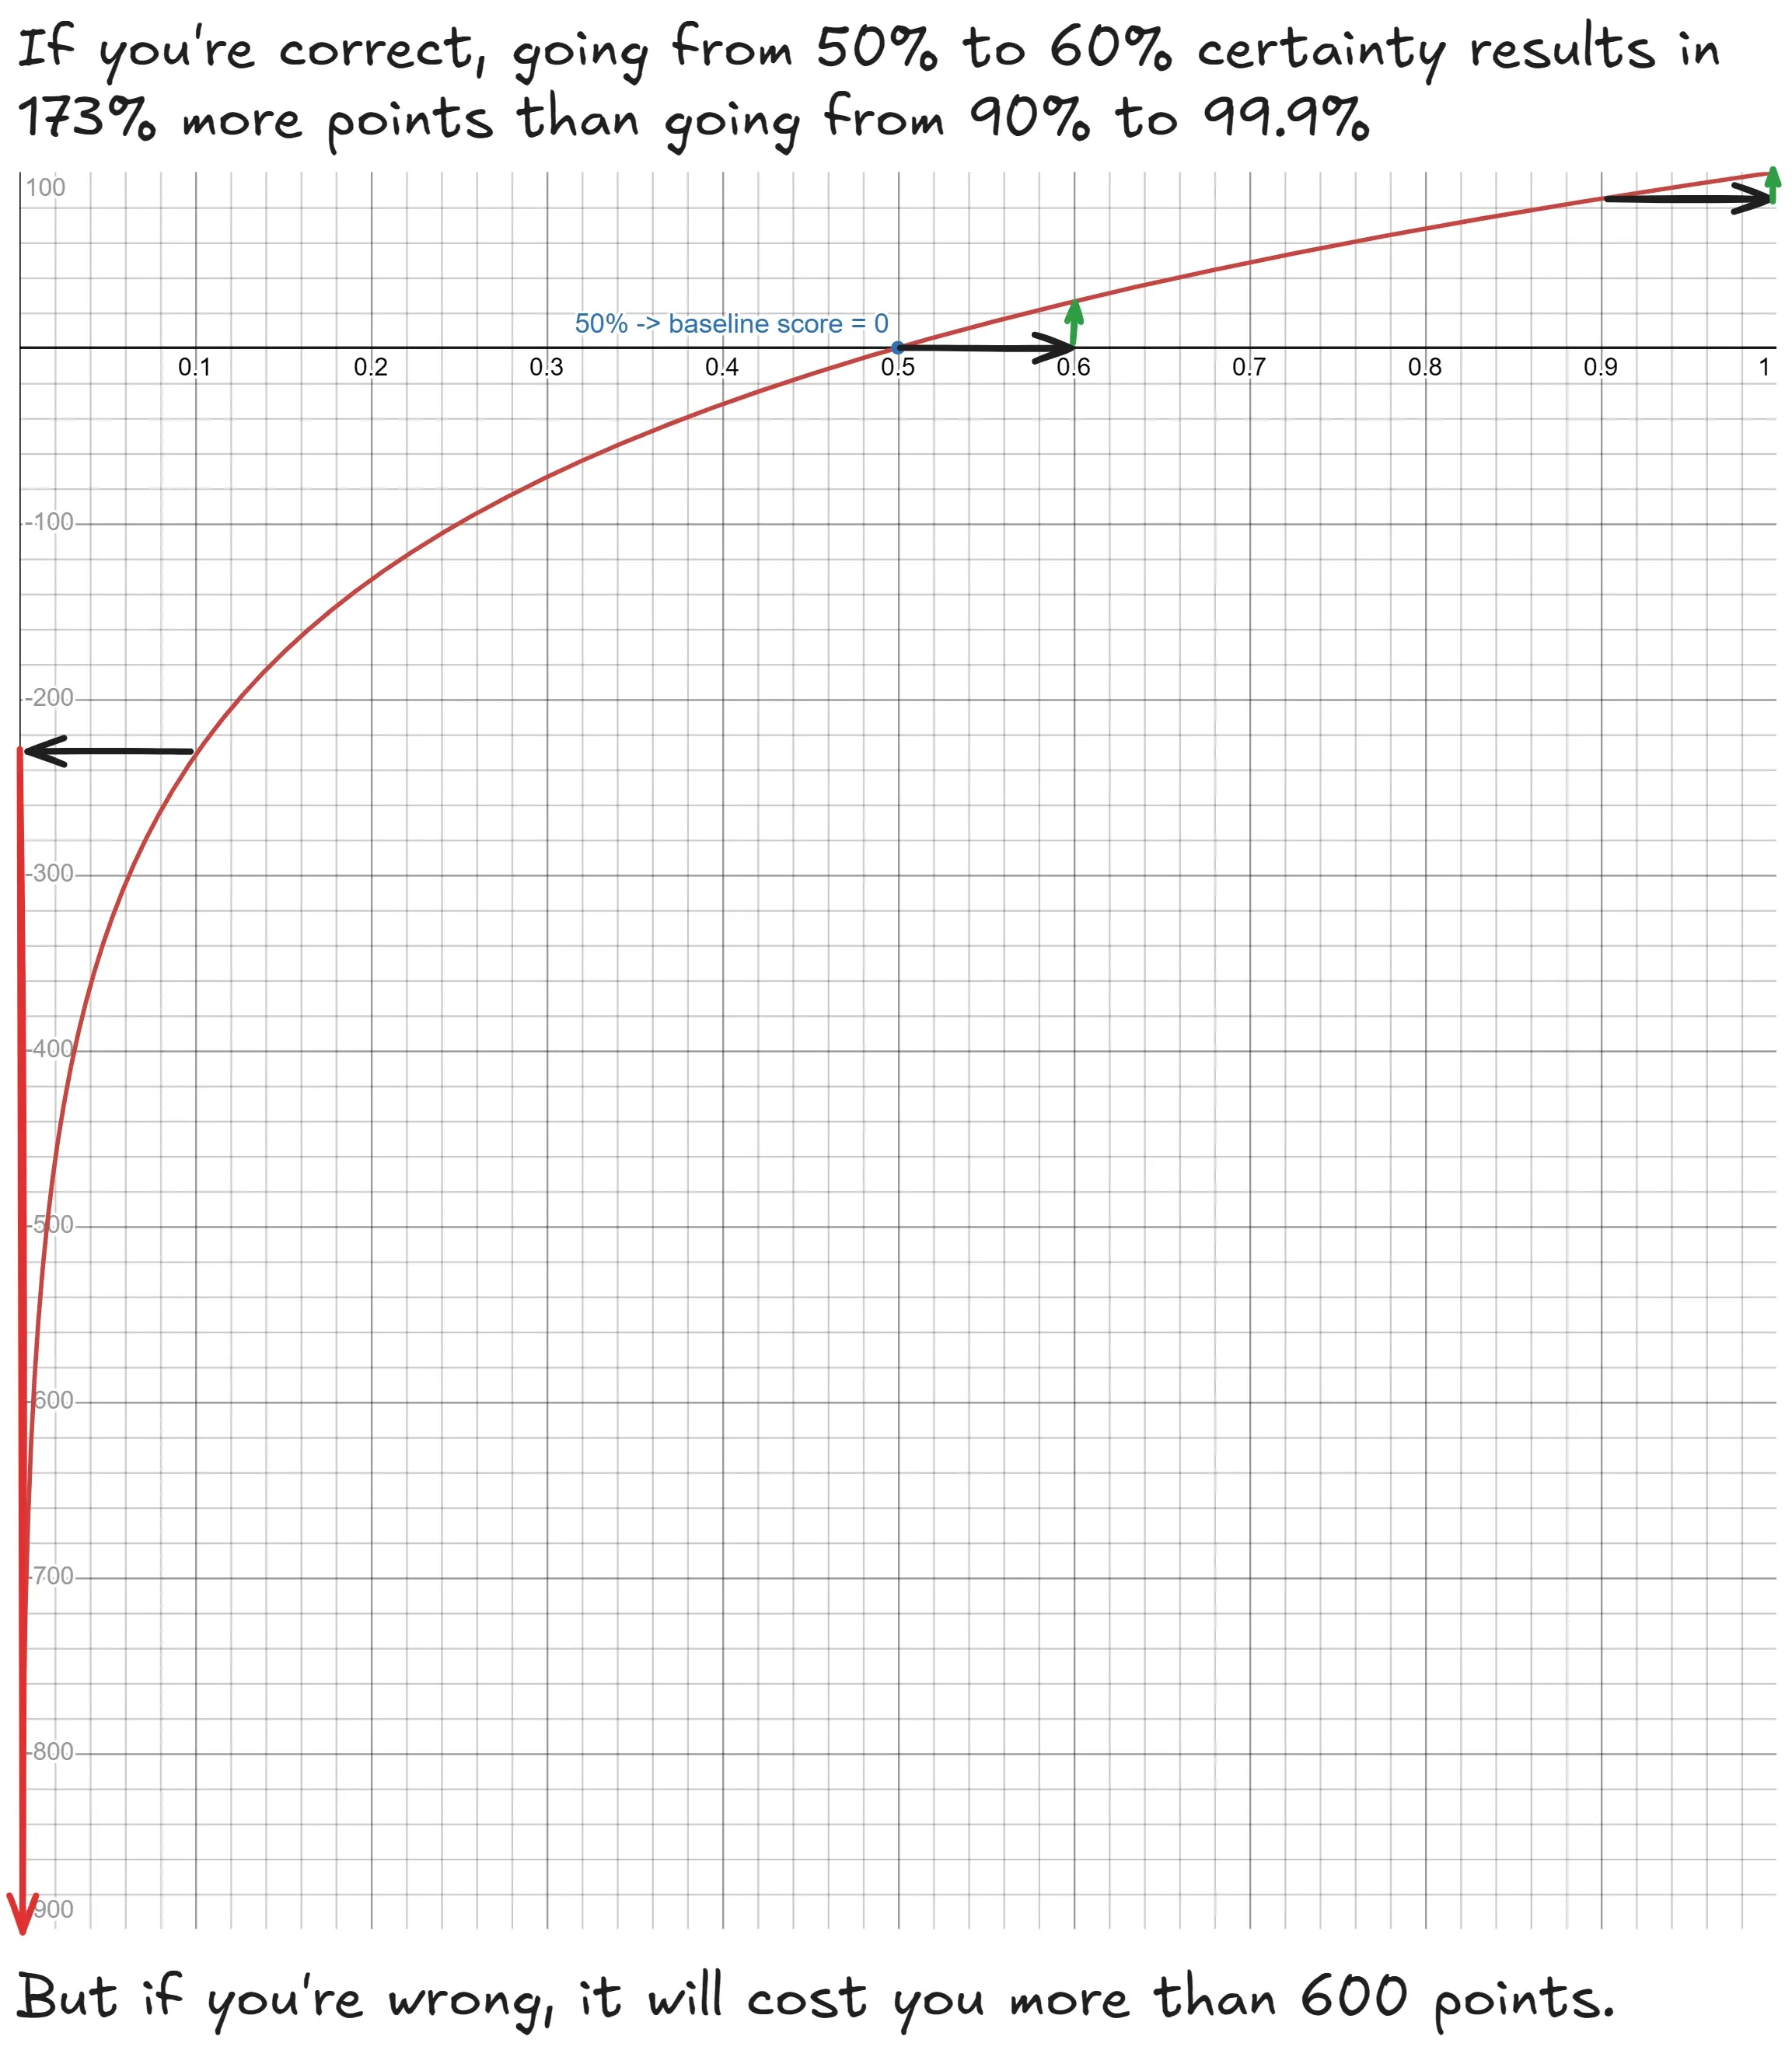
Because of the characteristics of the logarithmic function, going from 90% to 99.9% certainty will give you very little extra points if you’re right, but in the case you’re wrong, it will cost you a looot.
But what actually determines your place in the tournament is your peer score. It’s the average difference of your baseline score to the scores of everyone else, which means that it measures your performance relative to others. It can also be negative, which indicates a below average performance.
The aggregate of everyone’s individual forecasts is also calculated for each question, this is called the community prediction. Because it takes an average, the peer score of the community forecast is better than that of most individual forecasters (see Kahneman (2021), Noise for an in depth exploration) - which usually means the community has a positive peer score. Outperforming the community prediction is an indicator of a very good performance.
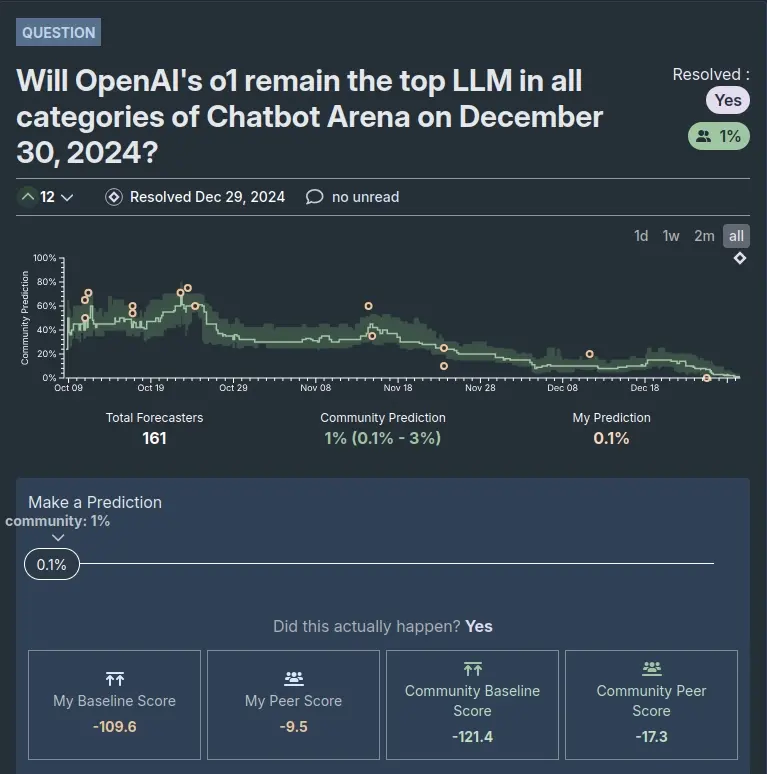
The image below shows Metaculus’s forecasting UI. The green line is the community prediction, the little orange dots are my predictions. Even though I locked in 0.1% in the end, my baseline score is very negative, as a result of my wrong earlier predictions. This is because being a little wrong weighs a lot more than being very correct (see the log score’s curve above).
My Results
Metaculus offers an API, with a public OpenAPI spec. I could very easily export my results to analyse them (thanks Metaculus dev team!). If you want to do the same, pull my scripts from GitHub and get a handy HTML report.
My total peer score is less than that of the community prediction, which scored a total of 692 points - it would have placed 9th. My goal for next quarter is to perform better than the community overall (I already achieved this for 14 out of 42 questions).
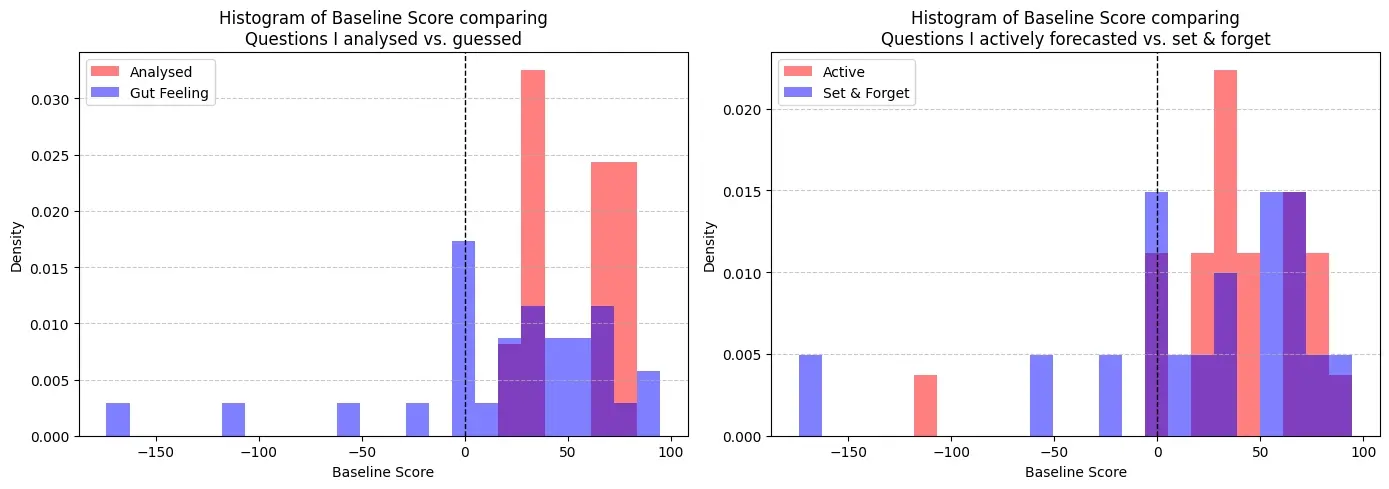
On a positive note, my forecasts were still better than blindly predicting an equal chance for all outcomes, as the sum of my baseline scores is positive. I then labelled all questions based on the method I used to predict and how actively I followed the question as new information came in.
The first graph indicates that mathematical analysis leads to better and more consistent outcomes, which would make sense. It also looks like I made wildly wrong gut feeling guesses on some occasions, which lead to very negative baseline scores. The second graph compares the baseline scores on questions which I actively updated, vs questions I updated once or twice and then mostly forgot. Again, it seems to indicate that active participation leads to a more consistent, positive outcome.
Here, I plotted my peer score for each question instead of my baseline score, which shows relative instead of absolute performance.
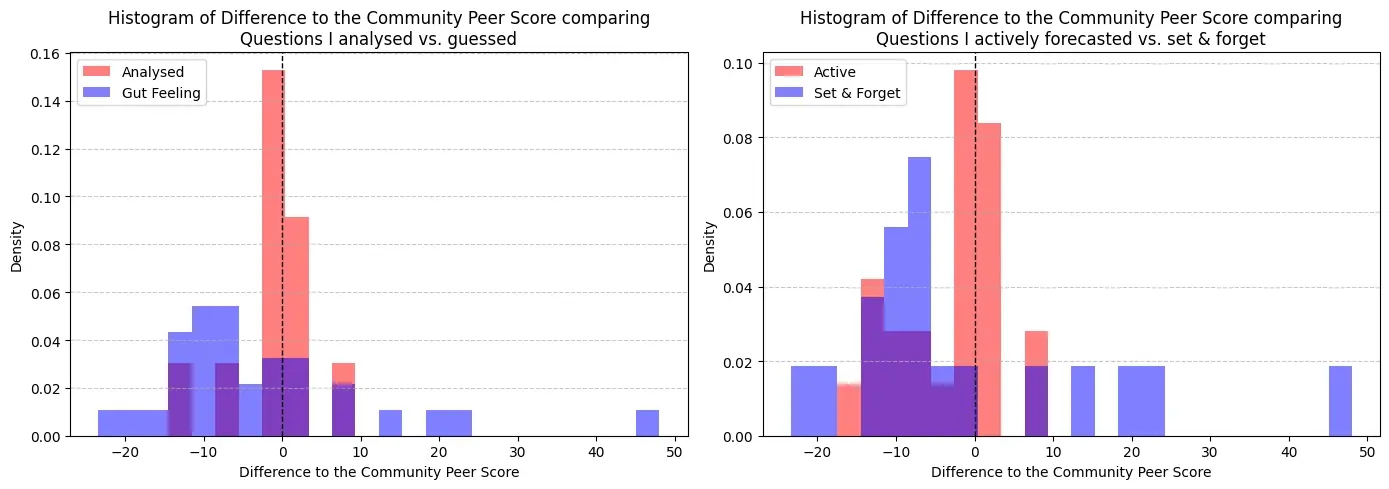
When comparing how much better or worse I was compared to the community peer score, the graphs seem to confirm those conclusions. Once again, questions that I analysed and updated often performed more consistently.
What they also show however, is that the large majority of my points come from questions I used my gut feeling for and then forgot to update (this means I was simply lucky, or worse, incompetent). These were questions where the community was very sure of an outcome which then didn’t come true.
A few examples would be:
-
What will be the closest color to the 2025 Pantone Color of the Year? -
+19.3peer score compared to the community. -
Will Astro Bot win the Game of the Year 2024 award? -
+21.57points -
Will at least one of Andrea Bocelli’s concerts at Madison Square Garden on December 18 or 19, 2024 sell out? -
+48.03points
Never make any extreme Predictions
The main improvement I can make is avoiding extreme probabilities - 99.9% or 0.01% - like the plague. Had I held off of these extremes, I could have walked away with a lot of points on at least 10 questions, where the community prediction was confidently wrong. Everyone tells you this, because intellectually everyone knows that it is risky. But in practice, this often gets overlooked: I certainly didn’t listen and paid the price.
For next quarter, I will set myself the hard limit of not going above 92% or below 8%. The upside is very high, the downside very limited. I chose these values according to my very sketchy calculations based on reverse engineering the scoring math in Metaculus’s source code.
If you go with 90% when the community is at 99.9%, you might only be behind by a few points, but if the prediction turns out to be wrong, you stand to gain a few hundred compared to everyone else.
Gaussians and Nassim Taleb
I used a variation of the bell curve for nearly all my analytical forecasts, mostly in the form of a random walk based on the standard deviation and mean of historical data.
Having recently read The Black Swan by Nassim Taleb, this seemed like a typical case of the cognitive dissonance evoked by Taleb in his book. Even though the phenomena in question weren’t at all Gaussian in nature, I still stubbornly stuck to Gaussian methods and tools.
The fat-tailed distributions hailed as the solution by Taleb naturally lead to less extreme probabilities, which is a good thing as we’ve seen above.
The issue of Nowcasting
To describe the other issue plaguing my predictions, I want to borrow the term nowcasting from meteorology. It’s very easy to fall into the trap of nowcasting when using analytical tools, as illustrated by my attempt at forecasting outlined below.
The question “Will Bluesky reach 30 million users before 1 January 2025?” lent itself ideally to using statistics, as data on new sign-ups was freely available. Thus, I set up a simple polling service, which fed the current sign-up rate into a simple model. It took the current users, the current sign-up rate and extrapolated the probability of reaching 30 million using a random walk.
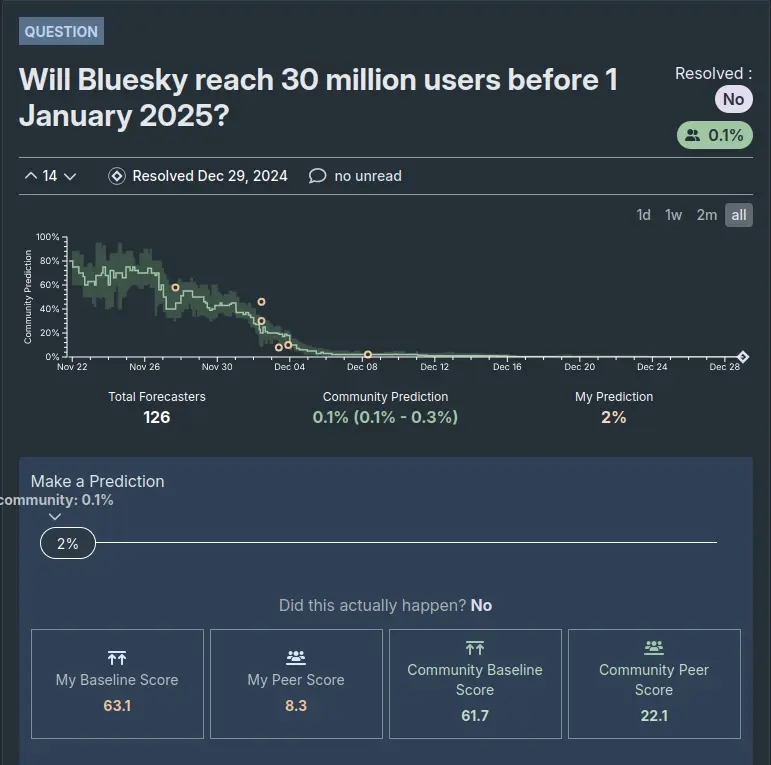
As time went on and the sign-ups slowed down as expected, the probability that my model spit out decreased, as is mirrored by the predictions I made on Metaculus.
I think this approach shouldn’t be called forecasting, but rather nowcasting. This is the wrong way to go about it. Instead of naively using the current rate, I should have thought about the different reasons for the sign-up rate to go up or down in the future. Thus, my numbers were correct, but not a real forecast.
I should have tried to find trends in the sign-up rate, built different models around those, based on what I thought the sign-up rate would do in the future. I would have arrived at a more realistic prediction much quicker.
Next Quarter
I urge you to participate in the tournament for Q1 2025 and explore forecasting, as it’s a fun mental exercise and a fun way to do test your data analysis skills. There are questions for everyone, be it geopolitics, economics or more mundane topics. It’s already open now and a few questions are waiting on you.
I’ll be participating as well, doing true forecasts (not nowcasts) using fat-tailed distributions and sticking to reasonable probabilities. And I’ll be trying to update my predictions more often…